Thursday, October 13, 2022

The Rules of the Lebensraum game.

1. SUMMARY

A battle for Lebensraum, i.e. energy,land, and food resources, broke out when Russia invaded Crimea.An associated covid pandemic, and global poverty and income disparity increases now threaten the UN’s Sustainable Development Goals. During the last major influenza epidemic in 1919 world population was 1.9 billion. It is now 7.8 billion+/ - an approximate four fold increase.
The IPCC and UNFCCC  post- modern science establishment's "consensus" is that a modelled future increase in CO2 levels is the main threat to human civilization. This is an egregious error of scientific judgement. The length of time used in making the models is much too small .
 A Millennial Solar " Activity" Peak in 1991  correlates with the Millennial Temperature Peak at 2003/4 with a 12/13 year delay because of the thermal inertia of the oceans. Since that turning point Earth has entered a general cooling trend which will last for the next 700+/- years.
The amount of CO2 in the atmosphere is .058% by weight.  That is one 1,720th of the whole. It is inconceivable thermodynamically that such a tiny tail could wag so big a dog.There is no anthropogenic CO2 caused climate crisis.
Because of the areal distribution and variability in the energy density of energy resources and the varying per capita use of energy in different countries, international power relationships have been transformed. The global free trade system and the global supply The global free trade system and the global supply chains have been disrupted.
Additionally, the worlds richest and most easily accessible key mineral deposits have been mined first and the lower quality resources which remain in the 21st century are distributed without regard to national boundaries and differential demand. As population grows,inflation inevitably skyrockets. War between states and violent conflicts between tribes and religious groups within states will continue to multiply.

2. Climate - Basic Science.

Earth’s climate is the result of resonances and beats between the phases of natural cyclic processes of varying wavelengths and amplitudes. At all scales, including the scale of the solar planetary system, sub-sets of oscillating systems develop synchronous behaviors which then produce changing patterns of periodicities in time and space in the emergent temperature data. The periodicities pertinent to current estimates of future global temperature change fall into two main categories:

a) The orbital long wave Milankovitch eccentricity, obliquity and precession cycles. These control the glacial and interglacial periodicities and the amplitudes of the corresponding  global temperature cycles. 
b)  Solar activity cycles with multi-millennial, millennial, centennial and decadal time scales. 

The most prominent solar activity and temperature  cycles  are : Schwab-11+/-years ; Hale-22 +/-years ; 3 x the Jupiter/Saturn lap cycle  60 years +/- :; Gleissberg 88+/- ;  de Vries - 210 years+/-; Millennial- 960-1020 +/-. (1)


Fig. 1 Greenland Ice core derived temperatures and CO2 from Humlum 2016 (2)

Fig.1 shows that Earth has passed the warm peak of the current Milankovitch interglacial and has been generally cooling for the last 3,300 years. The millennial cycle peaks are apparent at about 10,000, 9,000, 8,000, 7,000, 2,000, and 1,000 years before now.  
Climate, and in particular precipitation, is dominated  mainly by the Obliquity modulated by the Precession. J. H. C. Bosmans et al 2015 (3)"Obliquity forcing of low-latitude climate"   shows that obliquity induced changes in the summer cross-equatorial insolation gradient explain obliquity signals in low latitude paleo climate records more usefully than the classical 65 degree north insolation curve alone. Yi Liu et al 2015 (4) in "Obliquity pacing of the western Pacific Intertropical Convergence Zone over the last 282,000 years "   " ... shows that the western Pacific ITCZ migration was influenced by combined precession and obliquity changes. The obliquity forcing could be primarily delivered by a cross-hemispherical thermal/pressure contrast, resulting from the asymmetric continental configuration between Asia and Australia in a coupled East Asian–Australian circulation system. "

 The Oulu Galactic Ray Count is used in this paper  as the "solar activity " proxy which integrates changes in Solar Magnetic field strength, Total Solar Insolation , Extreme Ultra Violet radiation, Interplanetary Magnetic Field strength, Solar Wind density and velocity, Coronal Mass Ejections, proton events, ozone levels and  the geomagnetic Bz sign.  Changes in the GCR neutron count proxy source  causes concomitant modulations in cloud cover and thus albedo. (Iris effect)

Eschenbach 2010 (5) introduced “The Thunderstorm Thermostat Hypothesis - how Clouds and Thunderstorms Control the Earth’s Temperature”. 

Eschenbach  2020(6) in https://whatsupwiththat.com/2020/01/07/drying-the-sky  uses empirical data from the inter- tropical buoy system to  provide a description of this system of self-organized criticality. Energy flow from the sun into and then out of the ocean- water interface in the Intertropical Convergence Zone  results in a convective  water vapor buoyancy effect and a large increase in  OLR This begins when ocean temperatures surpass the locally critical sea surface temperature to produce Rayleigh - Bernard convective heat transfer.

The Millennial Temperature Cycle Peak.

 Short term deviations from the solar activity and temperature  cycles are driven by ENSO events and volcanic activity.

Latest UAH Satellite Data (7) 

Global     Temp Data 2003/12  Anomaly +0.26 :  2023/02  Anomaly   -0.04 Net cooling for 19 years

NH          Temp Data 2004/01  Anomaly +0.37 :   2023/02 Anomaly   +0.17  Net cooling for 19 years

SH           Temp Data 2003/11  Anomaly +0.21:    2023/02 Anomaly      0.0  Net cooling for 19 years  

Tropics    Temp Data 2004/01  Anomaly +0.22 :   2023/02  Anomaly   - 0.11 Net cooling for 19 years.

USA 48    Temp Data 2004/03 Anomaly +1.32  :  2023/02 Anomaly    + 0.68 Net cooling for 19 years.

Arctic       Temp Data 2003/10 Anomaly +0.93 :    2023/02 Anomaly    - 0.24 Net cooling for 19 years

Australia   Temp Data  2004/02 Anomaly +0.80 :  2023/02 Anomaly    - 0.12  Net cooling for 19 years


F
ig 2 C
orrelation of the last 5 Oulu neutron cycles and trends with the Hadsst3 temperature          trends and the 300 mb Specific Humidity. ( 8,9 )        

The Oulu Cosmic Ray count in Fig.2C shows the decrease in solar activity since the 1991/92 Millennial Solar Activity Turning Point and peak There is a significant secular drop to a lower solar activity base level post 2007+/- and a new solar activity minimum late in 2009.  In Figure 2 short term temperature spikes are colored orange and are closely correlated to El NinosThe hadsst3gl temperature anomaly at 2037 is forecast to be + 0.05. 


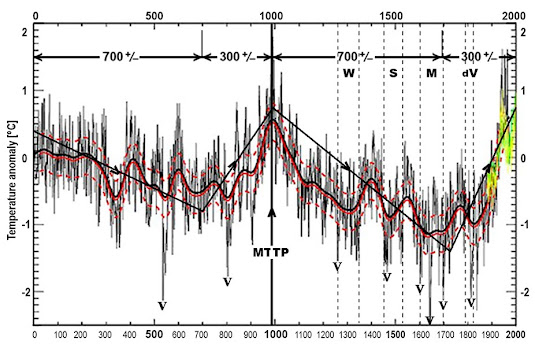
Fig.3 Northern Hemisphere 2000 year temperature reconstruction and a Millennial Temperature Turning Point. (MTTP). (7)

Because of the data quality, record length and methods used, the NH Christiansen et al 2012 series was selected as the "type reconstruction" to represent the NH trends. The de Vries, Maunder, Sporer  and Wolf minima are noted. Important volcanic cooling events are marked with a V.  An MTTP  occurs at about 990. The Millennial cycles are asymmetric with a 700+/- year down-leg and a 300 +/- year up-leg.

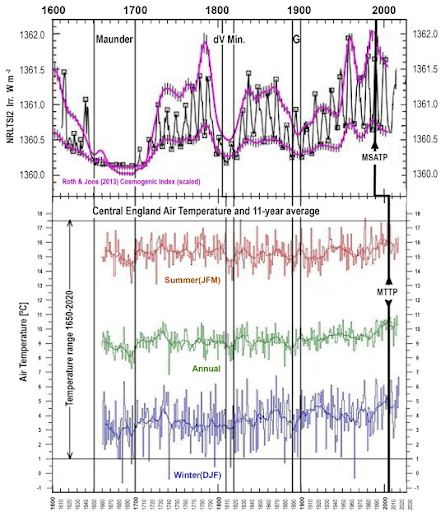
Fig 4  The NRLTSI2 Solar Activity - CET Relationship 1600- Present (8,9,10)

In Fig.3 the Roth & Joos Cosmogenic Index (CI) is used as the emergent proxy for the solar activity driver of the resulting emergent global and NH temperature data.

The effect on observed emergent behaviors i.e. global temperature trends, of the combined effect of these solar and GCR drivers will vary non-linearly depending on the particular phases of the eccentricity, obliquity and precession orbital cycles at any particular time.

Figure 3 shows an increase in CI of about 2 W/m 2 from the Maunder minimum to the 1991 activity peak. This increase, together with the other solar "activity" variations modulate the earth’s temperature and albedo via the GR flux and varying cloud cover.

The emergent temperature time series trends of the combined orbital, solar and GCR drivers also reflect turning points, changes of state and important threshold effects created by the interactions of the underlying physical processes. These exogenous forcings are also simultaneously modulated by changes in the earth’s magnetic field and length of day.

The temperature increase since the 1680s is due to the up- leg in the natural solar " activity" Millennial cycle as shown by Lean 2018 "Estimating Solar Irradiance Since 850 AD" (ibid)  Figure 3 also shows the correlation between the CI driver and the Central England Seasonal Temperatures. (ibid). The 1650 – 1700 (Maunder), 1810 - 20 (de Vries/Dalton), and the 1890-1900 (Gleissberg) minima are obvious. 
These temperature changes correlate very well with the changes in energy flow from the sun shown in Figure 1 C  without any measurable effect of C02.There is  no CO2 caused climate crisis.


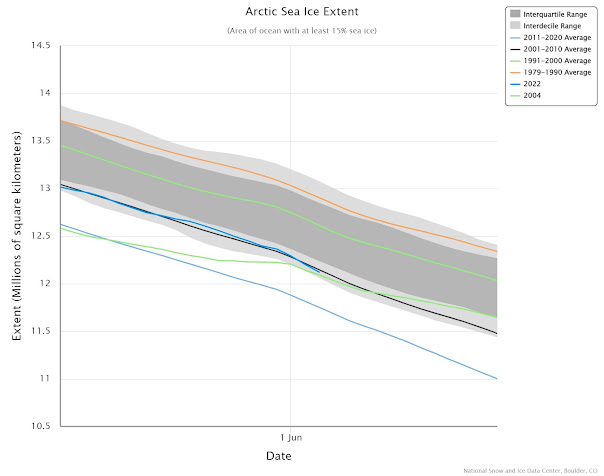
 3.Arctic Sea Ice Trends.

After reaching the minimum on September 18 2022, Arctic sea ice extent has been steadily increasing. With the passage of the equinox, the sun has set at the North Pole. September average ice extent ended up tying with 2010 for eleventh lowest in the satellite record. 1.30 million square kilometers (502,000 square miles) above the record minimum set in 2012. (11)

4. Arctic Sea ice volume.

Arctic sea ice reached its maximum extent for the year, at 14.62 million square kilometers (5.64 million square miles) on March 6. The 2023 maximum is the fifth lowest in the 45-year satellite record.

5. Sea Level.


                              Fig. 5 Sea Level   https://climate.nasa.gov/vital-signs/sea-level/

It can now be plausibly conjectured that a Millennial sea level peak  will follow  the Millennial solar activity peak at 1991/92 . This may occur at a delay of one half of the fundamental 60 year cycle  i.e at 2021/22.   see Fairbridge and Sanders 1987 (18).A possible Sea Level Peak and Turning Point may have been reached on Sept 17th 2022 with an anomaly of  104 mm. The anomaly at Nov 25th 2022 was 103 mm .


6. CO2 -Temperature and Climate.

The whole COP Net Zero meme is founded on the flawed assumptions and algorithms which produced the IPCC- UNFCCC model forecasts of coming dangerous temperature increases.

The "consensus"  IPCC models make the fundamental error of ignoring the long- term decline in solar activity and temperature following the Millennial Solar Activity Turning Point and activity peak which was reached in 1990/91 as shown in Figure 1

The amount of CO2 in the atmosphere is .058% by weight.  That is one 1,720th of the whole. It is inconceivable thermodynamically that such a tiny tail could wag so big a dog. (13)

 Stallinga 2020 (14) concludes: " The atmosphere is close to thermodynamic equilibrium and based on that we...…… find that the alleged greenhouse effect cannot explain the empirical data—orders of magnitude are missing. ……Henry’s Law—outgassing of oceans—easily can explain all observed phenomena.” CO2 levels follow temperature changes. CO2 is the dependent variable and there is no calculable consistent relationship between the two. The uncertainties and wide range of out-comes of model calculations of climate radiative forcing (RF) arise from the improbable basic assumption that anthropogenic CO2 is the major controller of global temperatures.
 Miskolczi 2014 (15) in “The greenhouse effect and the Infrared Radiative Structure of the Earth's Atmosphere “says "The stability and natural fluctuations of the global average surface temperature of the heterogeneous system are ultimately determined by the phase changes of water.”
  AleksanderZhitomirskiy 2022,(16) says: 
"The molar heat capacities of the main greenhouse and non-greenhouse gases are of the same order of magnitude. Given the low concentration of greenhouse gases in the atmosphere, their contribution to temperature change is below the measurement error. It seems that the role of various gases in the absorption of heat by the atmosphere is determined not by the ability of the gas to absorb infrared radiation, but by its heat capacity and concentration.  "  
Zaichun Zhul et al 2016 (17) in Greening of the Earth and its drivers report “a persistent and widespread increase of growing season integrated Leaf Area Index (greening) over 25% to 50% of the global vegetated area from 1982 - 2009. ………. C02 fertilization effects explain 70% of the observed greening trend.”
 Policies which limit CO2 emissions or even worse sequester CO2 in quixotic CCS green-washing schemes  would decrease agricultural food production and are antithetical to the goals of feeding the increasing population and bringing people out of poverty.
 
The tropical rain forests and tropical oceans are the main source of the atmosphere's water vapor and the rainfall essential to life and agriculture on land. Potable and agricultural water supplies are now stretched to their limits in many areas because of the differing national demographics of global population increase. Temperature limits and Net Zero CO2 targets as set in the Paris Accords to ameliorate future temperatures are completely useless when formulating policies relative to adaptation to the actual real world problems. These require more local inputs for particular regional ecosystems delineated by coastlines,  major river basins and mountain range limited intra-continental divides.

7. Predictions.

a) Short Term

Svalgaard, (18) Says "That solar cycle prediction is still in its infancy is borne out by the extreme range of predictions of Cycle 25...........With the wide spread from 50, Kitiashvili (19), to 233,(McIntosh et al)  " 

In Fig 2 D  above  Kitiashvili,I 2020 (ibid)  estimated that Solar Cycle 25 will start after the 2020 solar minimum  and will be weaker than Cycle 24.The maximum of Cycle 25 solar activity in this paper is predicted to be at  2024/25 with a sunspot number of about 50 +/- 15. The correlative HadSST3gl anomaly is at 2037.The intervening solar activity minimum would be at 2031+/-.

The Oulu Galactic Ray Count is a much more useful proxy for the Solar "Activity" climate driver .The  1991 Solar Activity Peak and the key correlation with the secular drop in the GR count after 2007 are very obvious in Figure 2  C .The change in slope and projection beyond 2016 are related to that basic post 2007 baseline GCR shift.

b) Long Term.

Figure 4  shows that the up-leg in the Central England Temperature  has an annual absolute temperature Millennial cycle amplitude of at least 16.5 +/- degrees C. Using the Millennial cycle lengths of Figure 3 at least that same amount of future cooling as from the 990 AD high (2004 analogy) to the Little Ice age is probable by the winters of 2,680-2700 +/-. The exact pathway from the 2003/4 Millennial temperature  high to the 2700 +/-low cannot be determined, but we can have high confidence in the general trend. 

Policymakers may wish to note the following possible effects on earth’s climate for this long cooling cycle.  Climate in the Northern Hemisphere in particular will be more variable. From time to time the jet stream will swing more sharply North – South. with more northerly extreme heat waves, droughts and floods and more hard winters with more early fall and late spring frosts. A cooler world with lower SSTs usually means a dryer world. Thus droughts will be more likely in for example east Africa with possible monsoon failures in India. In California the PDO will mean less rainfall with more forest fires in the south. However in the Cascades and Northern Sierras snowpack could increase since more of the rain could occur as snow. In Europe cold winters and cool cloudy summers will be more frequent. .There will be a steeper temperature gradient from the tropics to the poles so that violent thunderstorms with associated flooding, tornadoes and blizards will be more frequent in the central USA. Hurricanes may strike the USA east coast with greater frequency in summer and storm related blizzards will be more common in winter.  

8 The Rules of the Game - Energy Sources, Population Demographics and Sustainability.

The human species population level varies much like the slime mold Physarum polycephalum - we seek out and eat our carbon based food which was derived from the photosynthesis of solar energy. There are inter and intra species battles for the living space and its derived food Energy needed for survival. Humanity contends with all other species including COVID 19 and its variants in a Darwinian struggle for lebensraum.

Agricultural monocultures based on chemical fertilizer and insecticides have already decimated bird populations in the northern hemisphere.  Rosenberg et al 2019 in "Decline of the North American Avifauna" (2O) says: "Integration of range-wide population trajectories and size estimates indicates a net loss approaching 3 billion birds, or 29% of 1970 abundance ...Steep declines in North American bird populations parallel patterns of avian declines emerging globally.” The latest WWF report (21) states:

 "The Living Planet Report 2022 is a comprehensive study of trends in global biodiversity and the health of the planet. This flagship WWF publication reveals an average decline of 69% in species populations since 1970. While conservation efforts are helping, urgent action is required if we are to reverse nature loss." 

Food insecurity, starvation, global poverty and income disparity increases  threaten the UN’s Sustainable Development Goals. Cross border migration is already out of control across the Rio Grande into the USA, from West Africa via Libya and Tunisia to Europe, out of Syria and also across the English channel. Loss of wildlife habitat to human habitation, cattle-ranching and ocean overfishing have accelerated species extinctions worldwide.

Modern industrial civilization, especially in large Megacities, cannot function for long without continuous adequate power and water supply, and functional global food and basic resource supply chains. The Lebensraum  war in Ukraine has given us a preview of wars  yet to come. The UNEP, IPCC and UNFCCC consensus” scientific community’s unwarranted focus on future CO2 levels, and global warming mitigation has  led to “net zero” energy policies being adopted by most Governments. Mainstream Media, in particular the BBC, NGOs and leading left- wing politicians have rushed to promote this  unnecessary,  quasi-religious non -science. Reality has dictated that after only a few months of war many European nations have been forced to change their plans to move rapidly away from fossil fuels and /or find alternate sources for their fossil  energy needs

Individual Governments, whether democratic or dictatorial have now to decide where and how they will draw the line between accommodation for other species and natural ecosystems and food supply, poverty reduction, economic development and consumer consumption levels. In the UK immigration policy led to Brexit  In the USA the de facto open border policies of the Biden administration have become the cause of bitter political battles.

The unnecessary proposed rapid transition to non- fossil fuels has created  an enormously expensive obstacle in the way of the effort to attain a modern, ecologically viable ,sustainable global economy and functional International Political System. How is Putin's drive for Lebensraum to be stopped without a nuclear exchange. What are the current rules of the Darwinnian  Lebensraum game to be and who will enforce them?

References. 


 1.Fairbridge. R .and Sanders.J. in Climate. Rampino et at al Eds. pp 452,453, 458 The Suns Orbit A.D.750 -2050.  Van Rostrand Reinhold Co. (1987)

2.Humlum O. An overview to get things into perspectiveFigure    3, www.climate4you.com/ (2016)  3, www.climate4you.com/ (2016)

3. Bosmans, J. Hilgen,F et al Obliquity forcing of low-latitude climate.   Clim. Past, 11, 1335–1346, (2015)
https://www.nsstc.uah.edu/data/msu/v6.0/tlt/uahncdc_lt_6.0.txt
4, Liu,Y Lo, Li et al Obliquity pacing of the western Pacific Intertropical Convergence Zone over the last 282,000 years. Nat   Commun 610018 (2015). https://doi.org/10.1038/ncomms1001 (2015)
5. Eschenbach. The thunderstorm thermostat hypothesis how clouds and thunderstorms control the earths Temperature E&E https://doi.org/10.1260/0958-305X.21.4.201  (2010) 
6. Eschenbach. W  (2020)  https://whatsupwiththat.com/2020/01/07/drying-the-sky 
7. https://www.nsstc.uah.edu/data/msu/v6.0/tlt/uahncdc_lt_6.0.txt
10 Lean,J.L Estimating Solar Irradiance Since 850 CE Earth and Space Science.5. 2018
9.Roth,R & Joos E  A reconstruction of  radiocarbon production and total solar irradiance from the Holocene 14 and CO2     records:Clim.Past,9,1879-1909,(2013)
10. Humlum.O  https://www.climate4you.com/ Central England Temperatures.
11.https://nsidc.org/arcticseaicenews/
12.https://psc.apl.uw.edu/research/projects/arctic-sea-ice-volume-anomaly/
13.https://micpohling.wordpress.com/2007/03/30/math-how-much-co2-by-weight-in-the-atmosphere/
14. Stallinga, P.  Comprehensive Analytical Study of the Greenhouse Effect of the Atmosphere. Atmospheric and Climate   Sciences, 10, 40-80 (2020)
15.Miskolczi. The greenhouse effect and the infrared radiative structure of the earth's atmosphere. Development in Earth Science Volume 2 (2014)
16.Zhitomirskiy,A  Absorption of heat and the greenhouse gas effect. https://independent.academia.edu/AleksanderZhitomirskiy  (16) 
17. Zaichun Zhul et al Greening of the Earth and its drivers. Nature Climate Change Vol 6 April (2016)
18. Svalgaard,2020 https://arxiv.org/ftp/arxiv/papers/2010/2010.02370.pdf
19.Kitiashvili.I.N. Using Synoptic Magnetograms for Long-Term Solar Activity Forecast  https://orcid.org/0000- 0003-4144-227
20.Rosenberg et al 2019 in "Decline of the North American Avifauna"doi: 10.1126/science.aaw1313. Epub 2019 Sep 19
21.Living Planet Report  https://livingplanet.panda.org/en-US/

 Note as of 2/22/2023 References are in the process of being updated
will.page21@gmail.com

Fig 6 Preliminary.


Tuesday, June 7, 2022

The End of the UNFCCC/IPCC Global Warming Meme .

The End of the UNFCCC /IPCC Global Warming Meme.

1.The Millennial Global Temperature Cycle.

Planetary orbital and solar activity cycles interact and combine to drive global temperatures. Because of the thermal inertia of the oceans there is a 12+/- year delay between these drivers and global temperature. The amount of CO2 in the atmosphere is 0.058% by weight. That is one 1,720th of the whole atmosphere. It is inconceivable thermodynamically that such a tiny tail could wag so big a dog. The Oulu galactic cosmic ray count provides a useful proxy for driver amplitude. 

The statements below are supported by the Data, Links  and Reference in parentheses  ( ) at     https://climatesense-norpag.blogspot.com/2021/08/c02-solar-activity-and-temperature.html

A Millennial Solar Activity Turning Point (MSATP) was reached  in 1991/2. The  correlative temperature peak and Millennial  Temperature Turning Point (MTTP ) was in 2003/4 as also reported in  Nature Climate Change | VOL 12 | April 2022 | 380–385 | www.nature.com/natureclimatechange :Tang et al Increasing terrestrial ecosystem carbon release in response to autumn cooling and warming.

Because of the thermal inertia of the oceans the UAH 6.0 satellite Temperature Lower Troposphere  anomaly was seen at  2003/12 (one Schwab cycle delay) The Northern Hemisphere temperature anomaly peaked at 2003/12 at  0.37.There has been no net NH warming for 18 years. Earth passed the peak of a natural Millennial temperature cycle trend in 2004  and will generally cool until 2680 – 2700.

        Fig. 1: Trends in mean autumn air temperature at 2 m north of 25° N during the                       periods 1982–2003 and 2004–2018.

a, Trends in autumn (September–November) temperature during 1982–2003. b, Trends in autumn temperature during 2004–2018. c, Trends in mean autumn temperature anomalies during both periods. The air temperature data were obtained from the CRU Time Series 4.0. The black line in c indicates the mean autumn temperature over the whole region north of 25° N (NH), and the blue and red lines indicate the average autumn temperature over the CAs and WAs, respectively. *P < 0.1; **P < 0.05; ***P < 0.01. The black line in b represents the extent of the cooling areas. Maps in a,b were generated using ArcGIS (version 10.7). Copyright © 1995–2019 Esri.

 Short term deviations from the Millennial trends are driven by ENSO events and volcanic activity.

       Fig 2 Correlation of the last 5 Oulu neutron cycles and trends with the Hadsst3 temperature          trends and the 300 mb Specific Humidity. (28,29)         

The Oulu Cosmic Ray count shows the decrease in solar activity since the 1991/92 Millennial Solar Activity Turning Point and peak There is a significant secular drop to a lower solar activity base level post 2007+/- and a new solar activity minimum late in 2009.The MSATP at 1991/2 correlates with the MTTP at 2003/4 with a 12/13 +/- year delay.  In Figure 2(5) short term temperature spikes are colored orange and are closely correlated to El NinosThe hadsst3gl temperature anomaly at 2037 is forecast to be + 0.05. 

 2.Arctic Sea Ice Trends.

Fig. 3 Mean Sea Ice Extents 1979 - 2020  and years  2022 and 2004. 

The current sea ice extent is a reflection of current arctic temperature integrated with  previous years.
Sea ice declined from orange1979 -1990 to lowest Blue line 2011- 2020 av. as temperatures warmed and modifying ENSO events occurred.. By 06/04/2022 ,truncated blue line, ice extent has   recovered close to that of 2001 - 2010 , Black line, which is also very close to the 2004 lower Green line  extent for the same day of that year.

                      Fig.4 Arctic Sea Ice Extent 2022 -2015 and 2011,2010,2006 and 2005

On day 156 of 2022 Arctic Sea Ice was the 12th lowest since 1979 and 822,000 sq kms greater than the 21st century El Nino related peak in 2016,lowest Blue Line.

3. Arctic Sea ice volume. 
Average Arctic sea ice volume in August 2022 was 6,400 km3. This value is the 10th lowest on record for August, about 1,400 km^3 above the record set in 2012.

4. Greenland Surface Mass Balance.


The accumulated SMB on August 31  2022 is the 6th lowest  on record and is compatible with a Millennial sea level peak and turning point as suggested in section 4.

4. Sea Level.


                              Fig. 5 Sea Level   https://climate.nasa.gov/vital-signs/sea-level/

It can now be plausibly conjectured that a Millennial sea level peak  will follow  the Millennial solar activity peak at 1991/92 . This may occur at a delay of one half of the fundamental 60 year cycle  i.e at 2021/22.   see Fairbridge and Sanders 1987 (18).The rate of increase in sea level from 1990 - present was 3.3 millimeters/year. The net rate of increase from Sept 13th 2019 to  Jan 13/ 2022 in Figure  5  was 2.3mm/year. A possible Sea Level Peak and Turning Point may have been reached at Jan 13 2022 with an anomaly of  102.2 mm. Sea level fell to  100.8 mm by Feb 21st 2022. 

The conjecture will be strengthened if the fall continues for the rest of the year as is suggested by the Southern Oscillation Index (SOI) May 2022


                                                         Fig.6  30 Day moving SOI

Sustained positive values of the SOI above +7 typically indicate La Niña (cooling) while sustained negative values below −7 typically indicate El Niño.(warming) Values between +7 and −7 generally indicate neutral conditions. Values at May 01 2022 indicate a possible strong  La Nina in Sept/Oct this year  leading to cooling. Conversely ,the solar activity of cycle 25 is increasing towards a 2024/5 peak with possible warming - Fig.2 D. We will see which trend dominates the fall 2022 sea ice minimum.    http://www.bom.gov.au/climate/enso/#tabs=Pacific-Ocean&pacific=SOI

5. Basic Science Summary.

The anthropogenic CO2 Radiative Forcing concept on which the climate models’ dangerous warming forecasts are based is inappropriate for analyzing atmospheric temperature changes. Solar sourced energy flows in and out of the Inter Tropical Convergence Zone provide the net negative feedback which has kept the earth within a narrow temperature range for the last 600 million years. The effects on temperature and climate of major meteorite strikes, periods of flood basalt outpourings , major volcanic eruptions and ENSO events are superposed on this solar sourced background. 

Most importantly the models make the fundamental error of ignoring the long- term decline in solar activity and temperature which will follow  the Millennial Solar Activity Turning Point and activity peak which was reached in 1990/91 as shown in Figure 2. above.   The UNFCCC Renewable Energy Targets in turn are based on model forecast outcomes which now appear disconnected from any possible reality.

The global temperature cooling trends from 2003/4 – 2704 are likely to be broadly similar to those seen from 996 – 1700+/- (Fig3,23,24 ) From time to time the jet stream will swing more sharply North – South. Local weather in the Northern Hemisphere in particular will be generally more variable with, in summers more northerly extreme heat waves, droughts and floods and in winter more early fall and late spring frosts.

6. Energy Sources, Population Demographics and Sustainability.

Modern industrial civilization, especially in large Megacities, cannot function for long without continuous adequate power supply, and functional global food and basic resource supply chains. The 2021 Texas freeze killed about 200 people. Long lines for food and water provided a red-flag warning of the present dangers of a cooling world. The war in Ukraine has given us a preview of future trends which were already underway. After only a few months of war nations are forced to abandon their rapid move away from fossil fuels. Food insecurity, starvation, global poverty and income disparity increases  threaten the UN’s Sustainable Development Goals. Cross border migration is out of control across the Rio Grande into the USA, and from West Africa via Libya to Europe and across the English channel. Loss of wildlife habitat to human habitation, cattle-ranching and ocean overfishing have accelerated species extinctions worldwide. Agricultural monocultures based on chemical fertilizer and insecticides have already decimated bird populations in the northern hemisphere.  Rosenberg et al 2019 in "Decline of the North American Avifauna" (39) says: "Integration of range-wide population trajectories and size estimates indicates a net loss approaching 3 billion birds, or 29% of 1970 abundance ...Steep declines in North American bird populations parallel patterns of avian declines emerging globally.”

  Zaichun Zhul et al 2016 (36) in Greening of the Earth and its drivers report “a persistent and widespread increase of growing season integrated Leaf Area Index (greening) over 25% to 50% of the global vegetated area from 1982 - 2009. ………. CO2 fertilization effects explain 70% of the observed greening trend.” Policies which limit CO2 emissions or even worse sequester CO2 in a quixotic attempt to greenwash or mitigate these natural cycles would decrease agricultural food production and are antithetical to the goals of feeding the increasing population and bringing people out of poverty. The tropical rain forests and tropical oceans are the main source of the atmosphere's water vapor and the rainfall essential to life and agriculture on land. Potable and agricultural water supplies are now competing and stretched to their limits in many areas because of the demographics of global population increase. Temperature limits and targets as set in the Paris accords to ameliorate future temperatures are in practice useless when formulating policies relative to adaptation to the actual real world problems. These require more local inputs for particular coastlines, different major river basins and mountain range limited ecosystems.

The UNEP, IPCC and UNFCCC “consensus” scientific community’s unwarranted focus on future CO2 levels, and global warming mitigation via “net zero” energy policies has been adopted by most Governments, Mainstream Media, NGOs and leading politicians as the basis for climate and energy policy. Individual Governments will now decide where and how, given their different political systems and demographics, they will draw the line between accommodation for other species and natural ecosystems and food supply costs, poverty reduction, economic development and consumer consumption levels.

Humanity contends with all other species including COVID 19 and its variants in a Darwinian struggle for lebensraum. During the last major influenza epidemic world population was 1.9 billion. It is now 7.8 billion+/. The establishment science “consensus" that a modelled future increase in CO2 levels and not this actual fourfold population increase is the main threat to civilization has no empirical basis. The cost of the proposed rapid transition to non- fossil fuels would create an unnecessary, enormously expensive. obstacle in the way of the effort to attain a modern ecologically viable sustainable global economy. We must adapt to the most likely future changes and build back smarter when losses occur.